Simulator
Simulator allows you to evaluate decision model while authoring. Main purpose is to help during development and * debugging*.
To open a simulator panel press Open Simulator button in top right corner while on your decision graph. A panel will open on your right side. To run a simulation, press Simulate button.
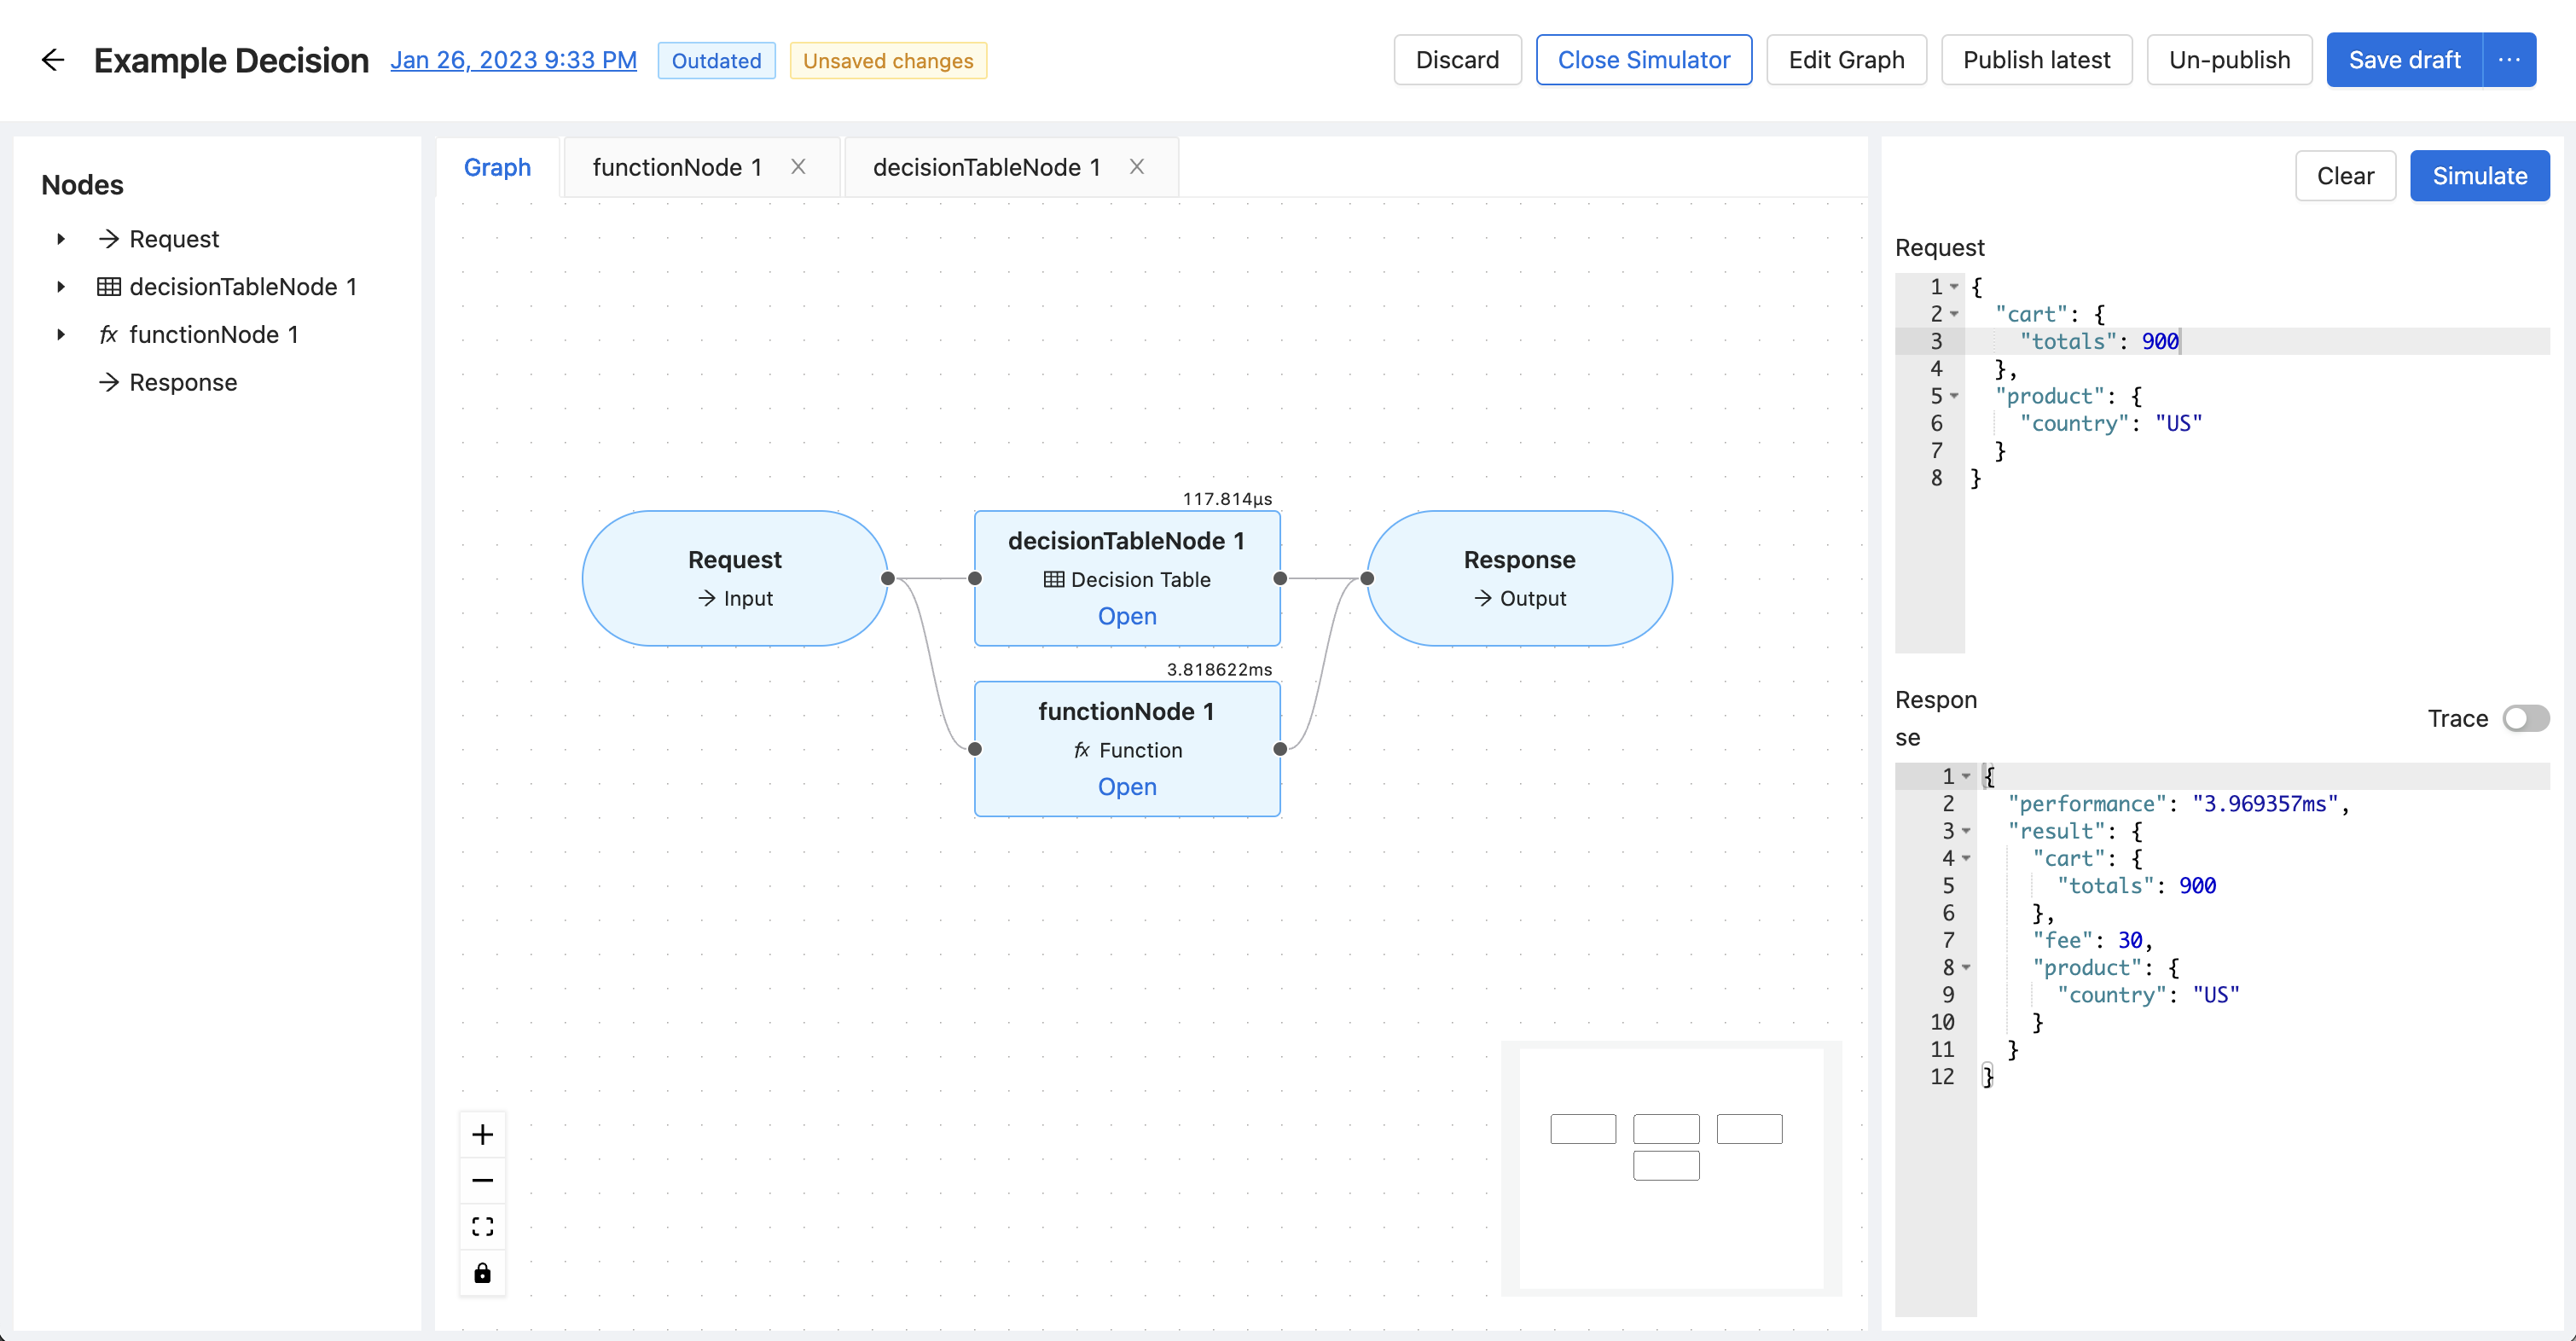
Furthermore, it provides you with useful information, such as performance and metadata of each node.
In the panels top editor you can provide a JSON data for your simulation which will represent request body of the graph. The panel will also contain a response on it's bottom side, where you can see the final result of the evaluation and the performance.
By toggling trace we are also able to see complete details of the decisioning logic on all nodes.
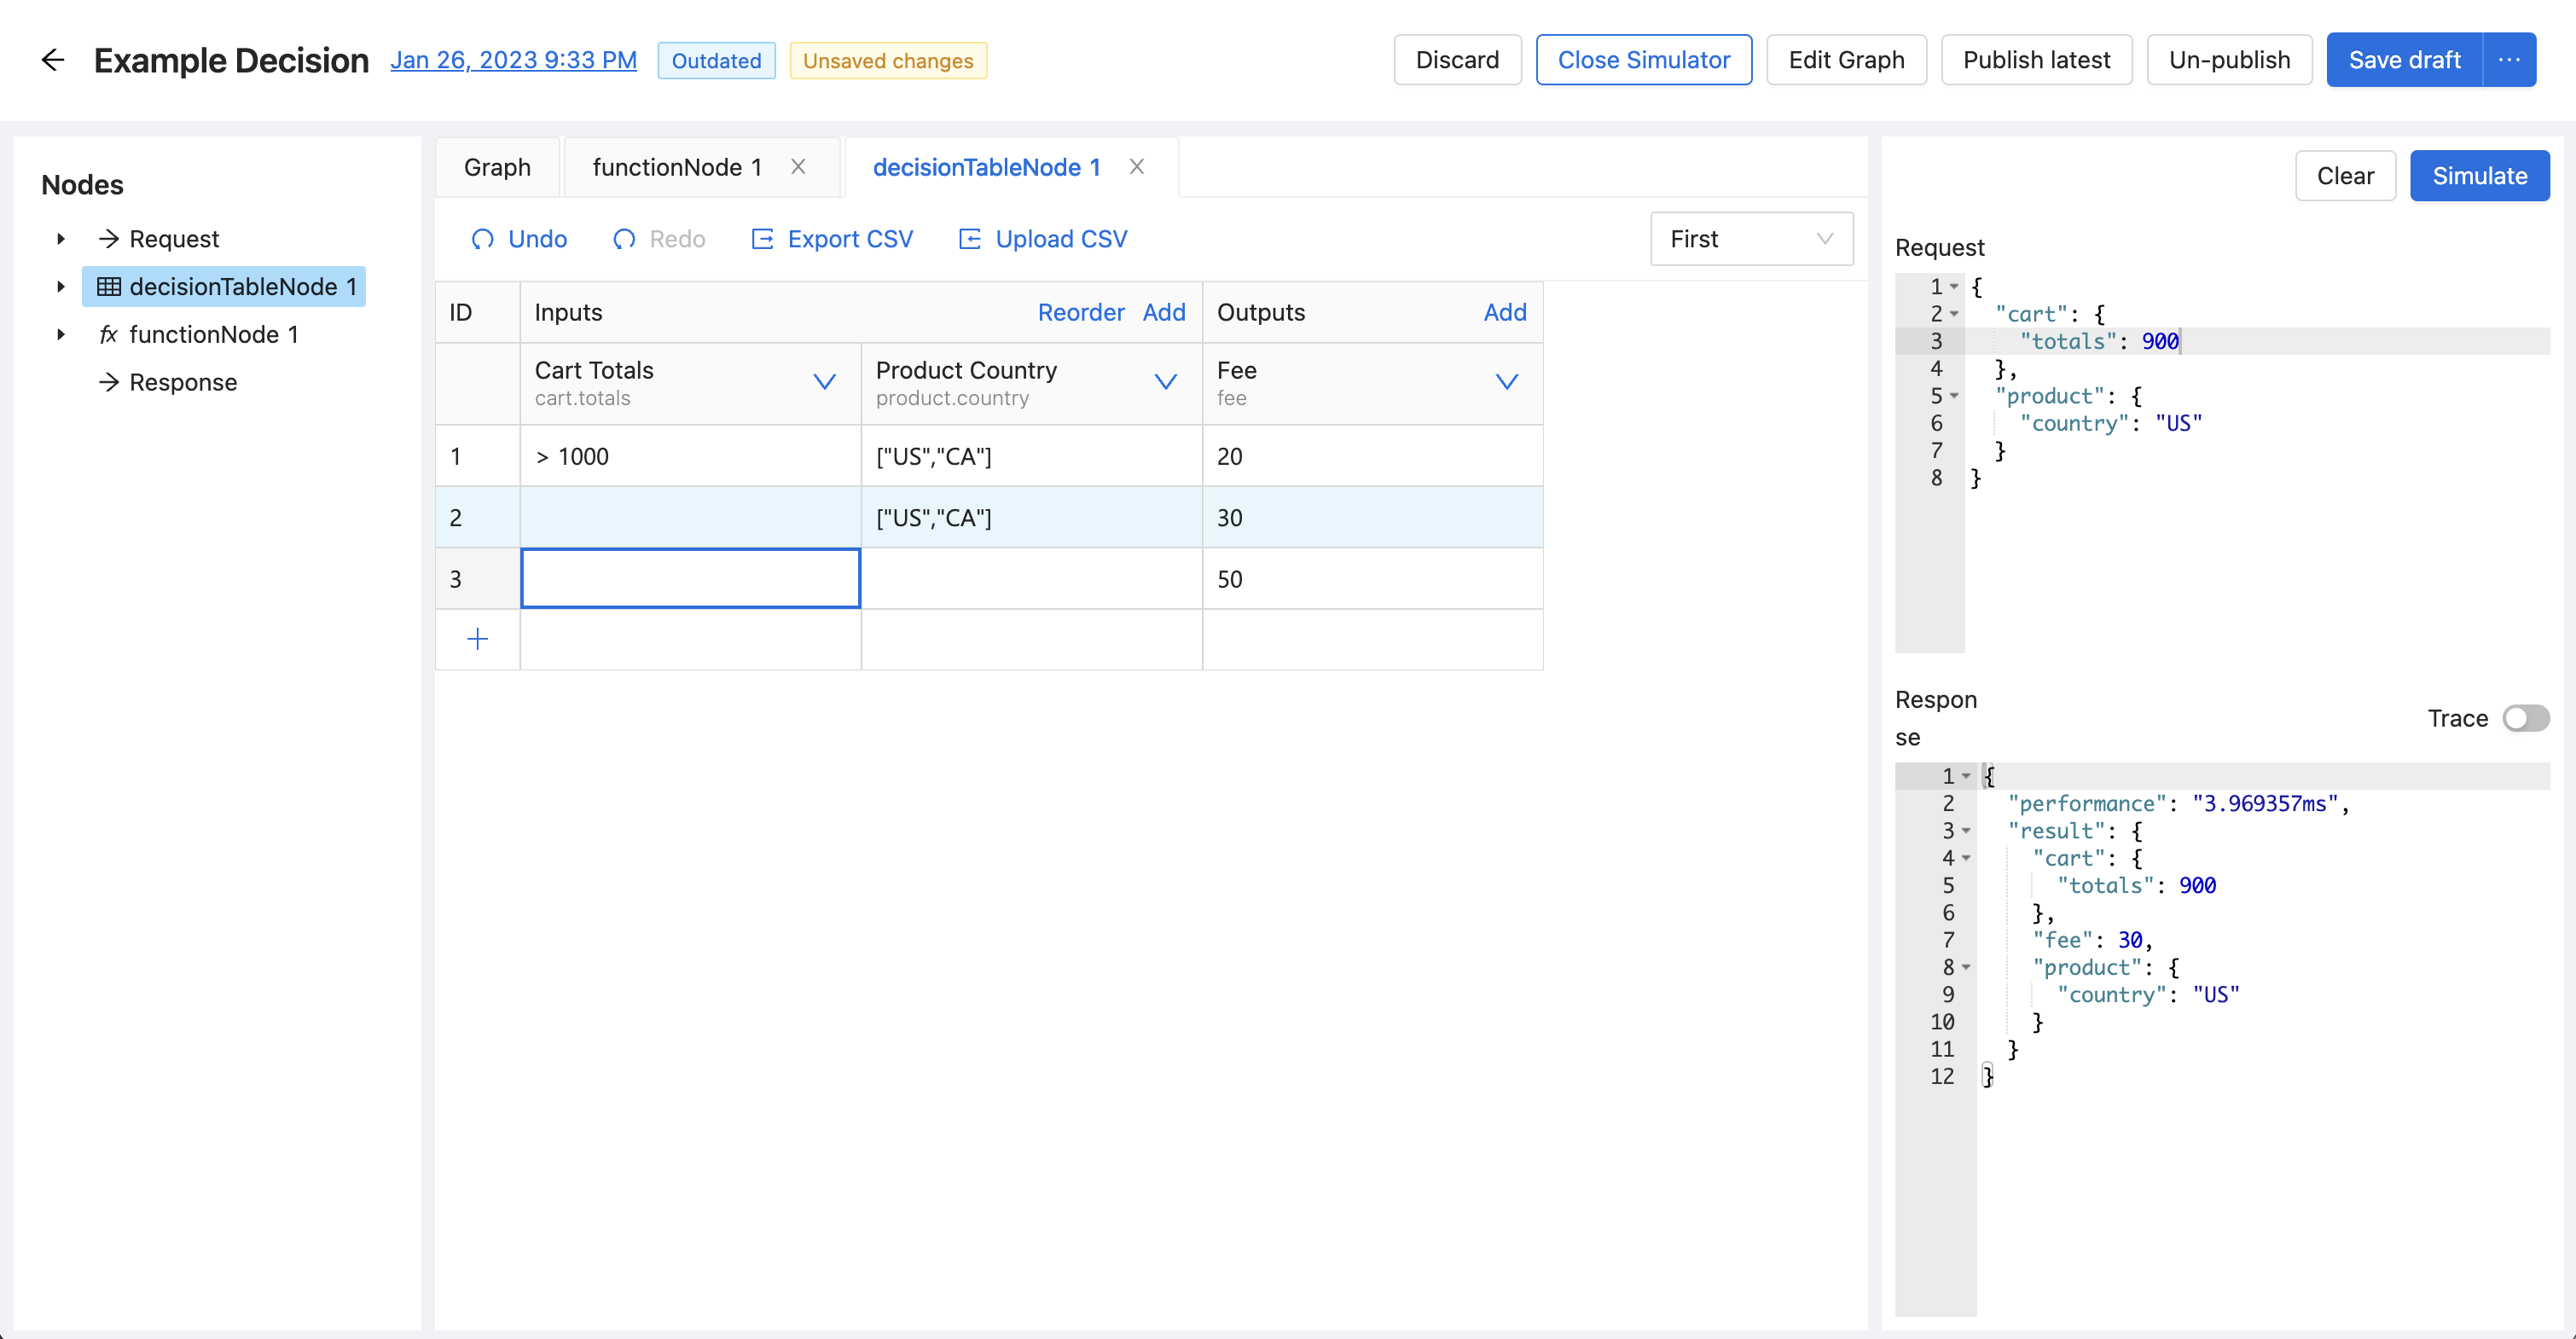
Inspecting decision tables
Tables may be inspected after simulation, and they will show which rule(s) have been hit by highlighting them.
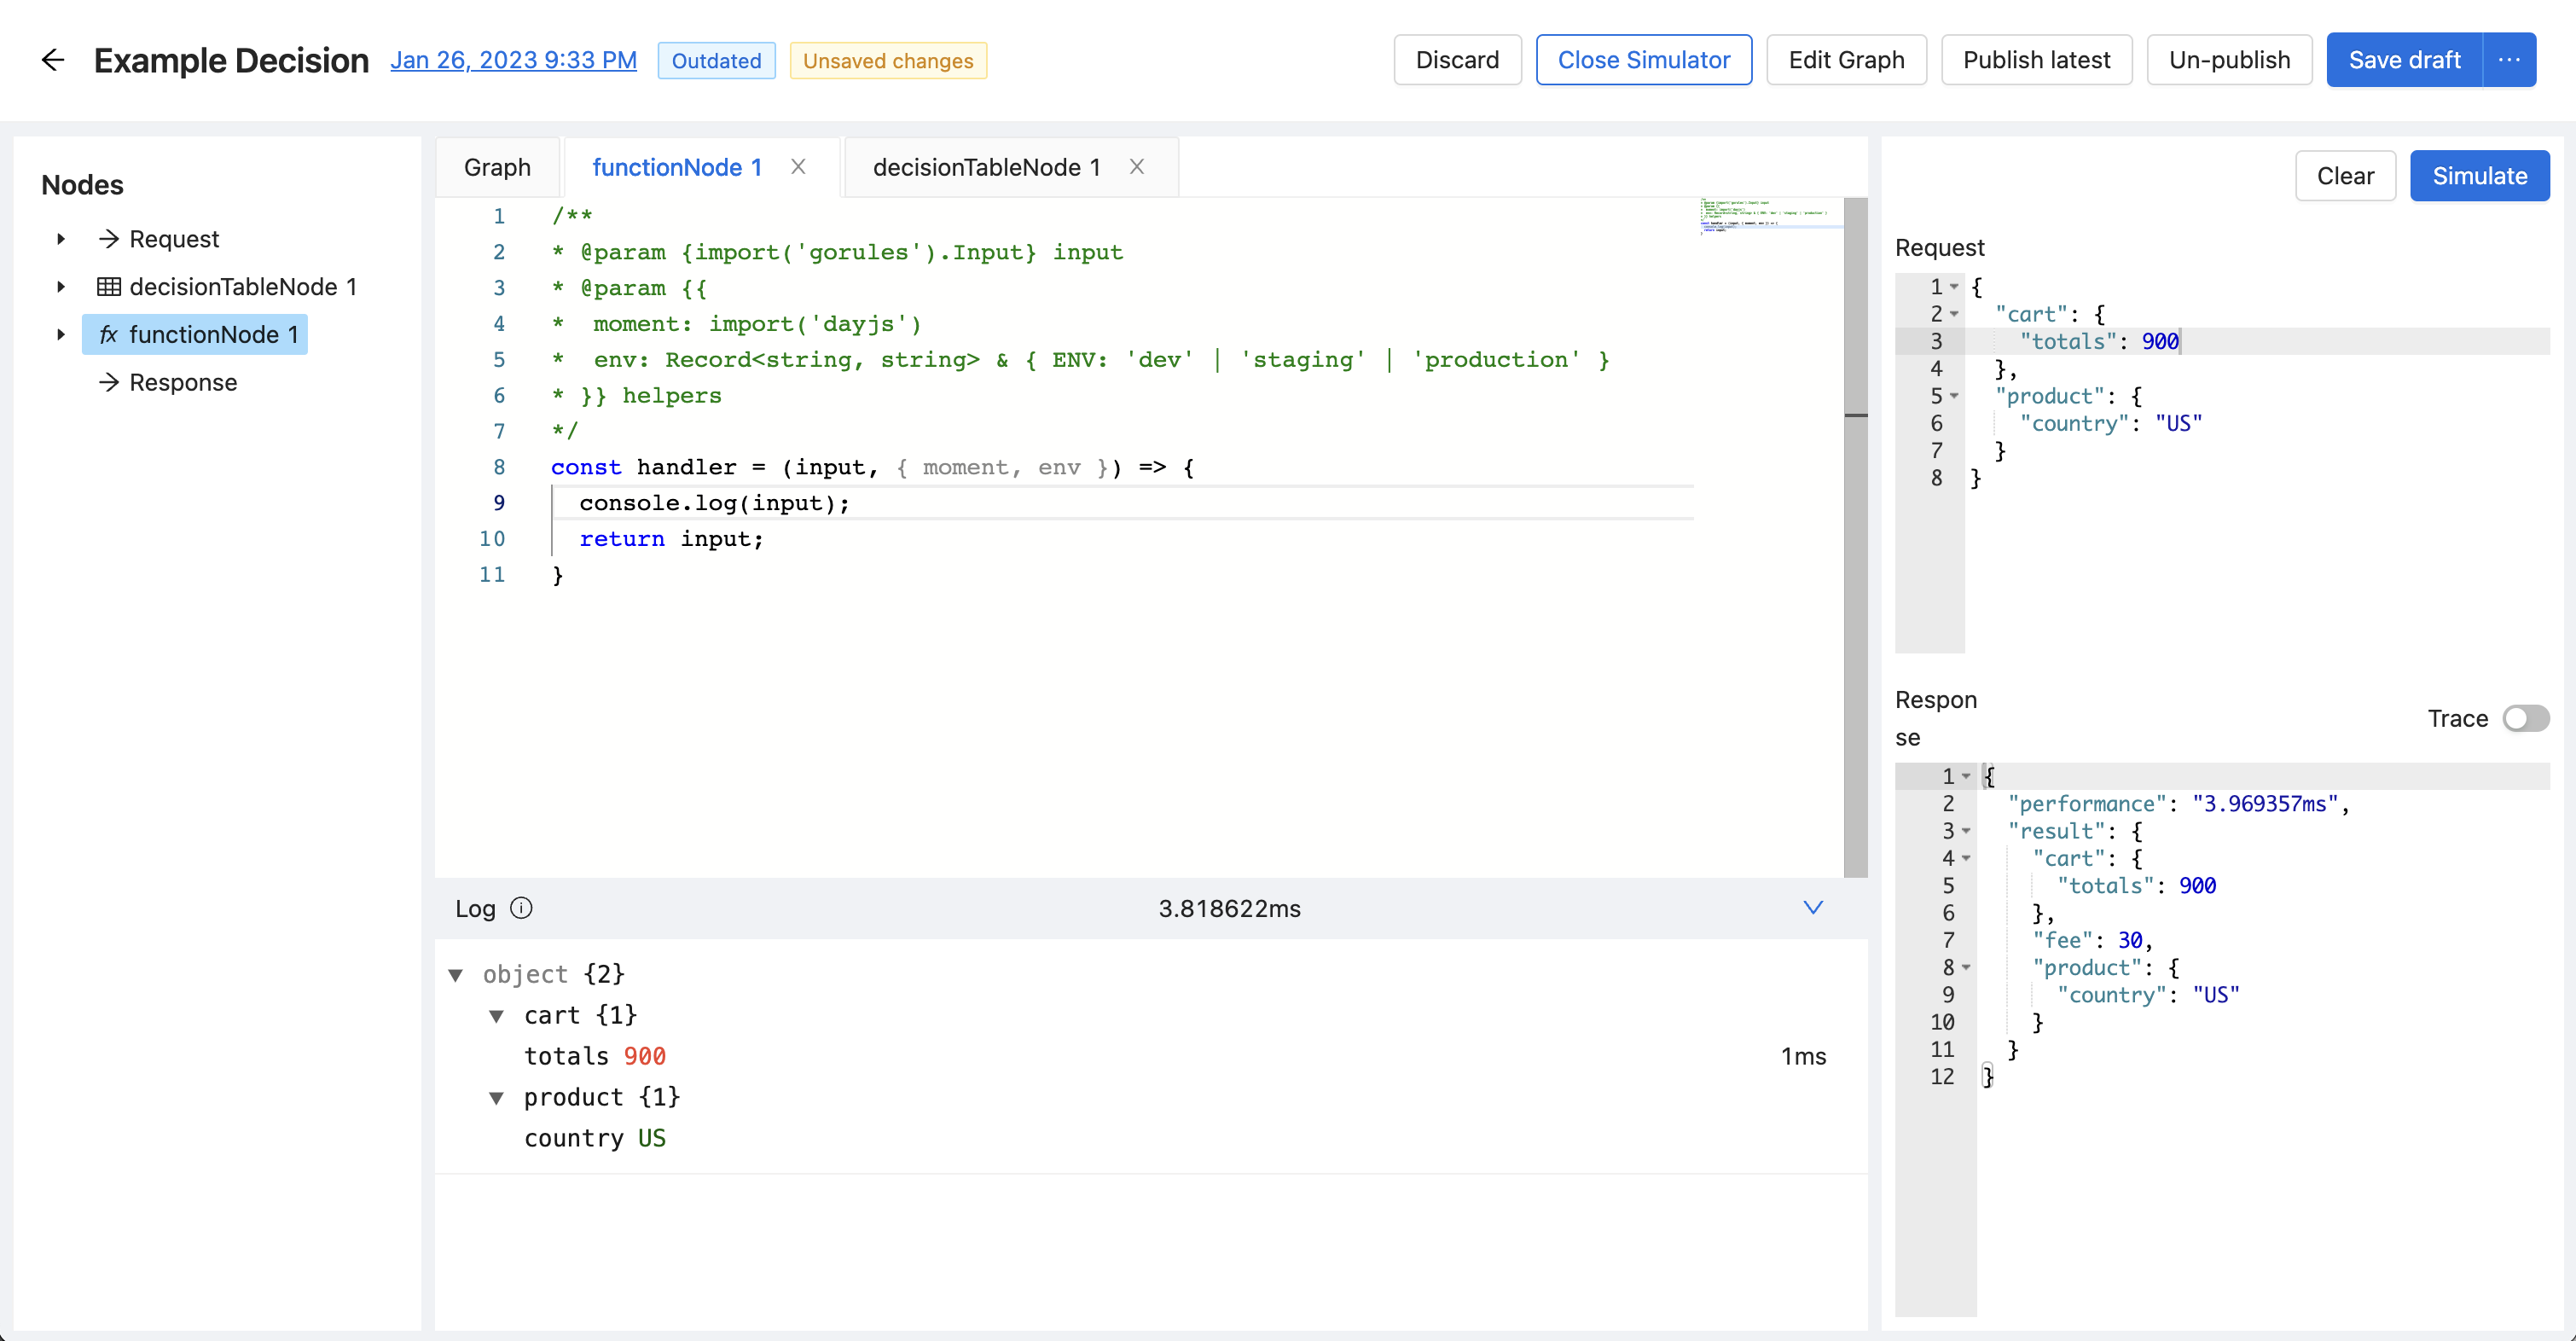
Inspecting functions
Functions will be able to show the information through console.log(s) in the bottom panel as such.
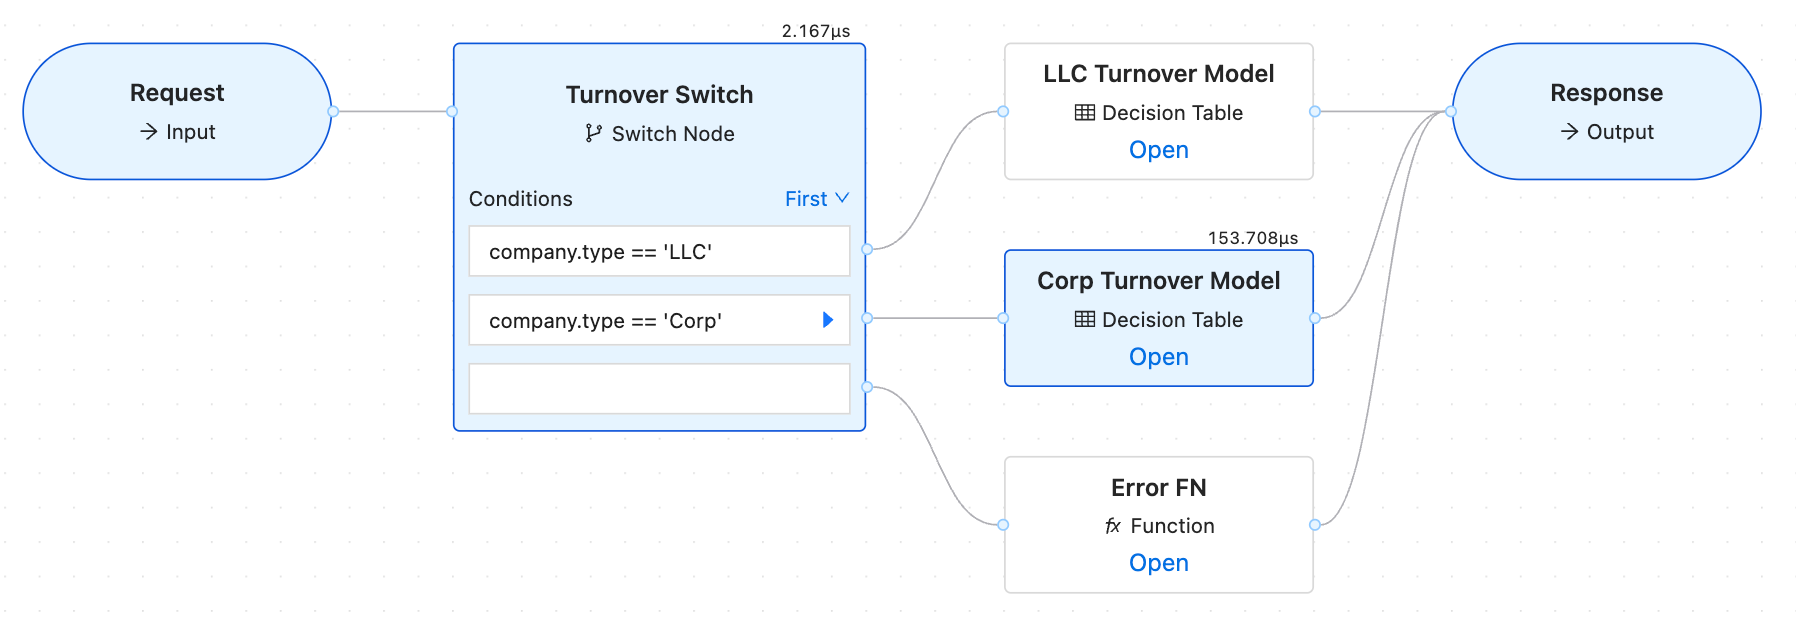
Inspecting switch
After simulation Switch node will display which path/branch did rules engine take during evaluation by adding chevron right next to the Expression as well as color entire graph.